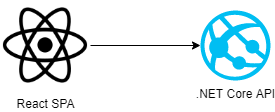
Azure Application Insights is frequently being used by workloads running on Azure. The most simple and common example of this is a Web Application calling a RESTful API. In most enterprise-y scenario, one would find it to be a single page app commonly written in React/Angular talking to a .NET/Java Web API. However a surprising number of developers don't use or haven't heard of telemetry correlation in Application Insights.
Azure SDK provides a robust mechanism of enabling telemetry correlation for various languages and frameworks. For .NET Core, this is turned on by default and you don't have to do any thing except adding Microsoft.ApplicationInsights.AspNetCore nuget package and including the following line in your code:
builder.Services.AddApplicationInsightsTelemetry();
For other frameworks, it is not as simple. Here I am going to show an example for a React app. This app is bootstrapped using Create React App (CRA) tool. Next create a file AppInsights.js and add following lines of code:
The following settings are crucial to enable this:
In this sample, the React app calls the default template Weather API created using .NET Core 6 Minimal API.
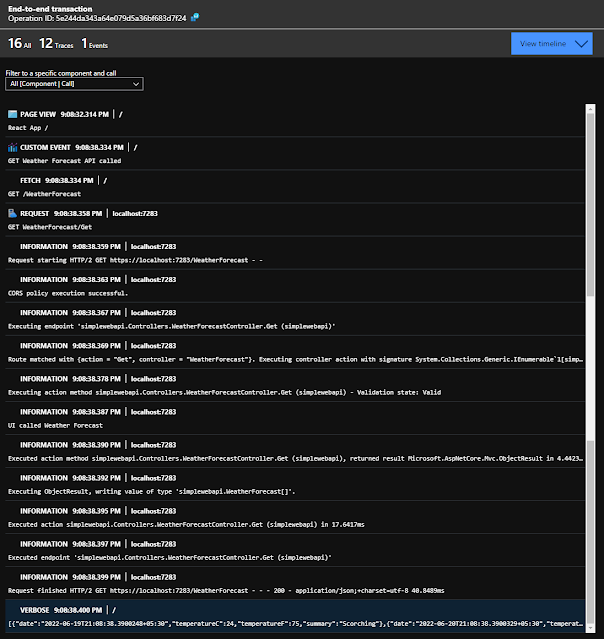
Once everything is set up and running, you will see the following logs in Application Insights:
You can see request originating from UI and travelling through API in a neat timeline view. You can find the complete code here - mayankthebest/appinsightstracing: Sample Project to showcase Distributed Tracing in Azure Application Insights. (github.com)
Depending on the framework that you are using, you may need to do some digging around in Microsoft documentation but once done, this feature will save lots of trouble when your app is running in production.


Comments
Post a Comment
As far as possible, please refrain from posting Anonymous comments. I would really love to know who is interested in my blog! Also check out the FAQs section for the comment policy followed on this site.